You ask, “What’s a histogram?” In photography, histograms are only a graphical depiction of the tonal values that you have captured in your pictures. Put more simply, it displays the brightness or darkness of your image. Without understanding its purpose, a histogram may simply appear as an odd graph.
For beginner photographers, the histogram is an excellent tool for swiftly and precisely assessing your exposure, yet it’s frequently ignored by amateurs and those new to photography.
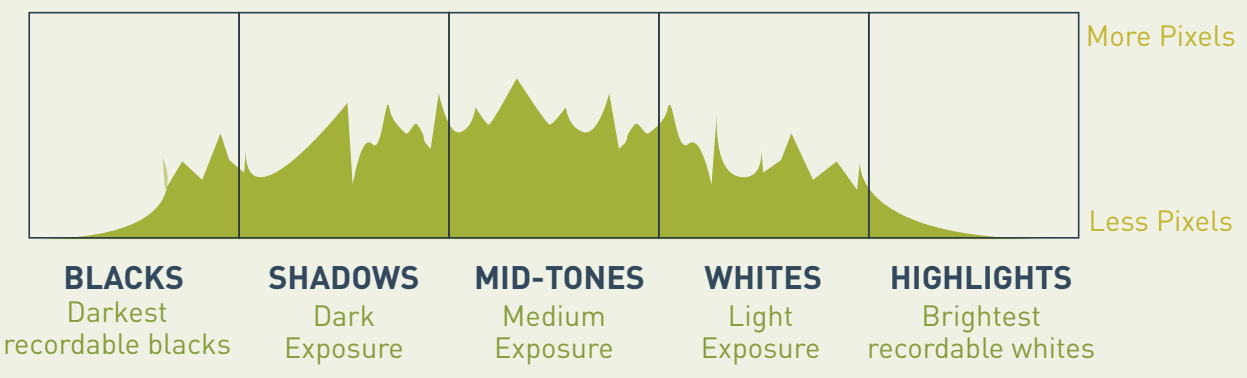
A histogram is a fundamental bar graph that presents a clear and concise visual representation of a given set of data. In photography, the histogram is used to demonstrate the pixels that constitute an image in a two-dimensional graph. The x-axis of the graph represents the brightness levels ranging from black on the left to white on the right, and this is the main area of focus. If the graph exceeds the left edge, it indicates the presence of excessively dark pixels while overflowing on the right side means that there are excessively bright pixels. Ideally, all pixels should fall within the left and right extremes.
There are three important types of histograms that every photographer needs to understand.
- RGB Histogram
- Specific Color Channels Histograms, Red, Green & Blue
- Luminosity Histogram
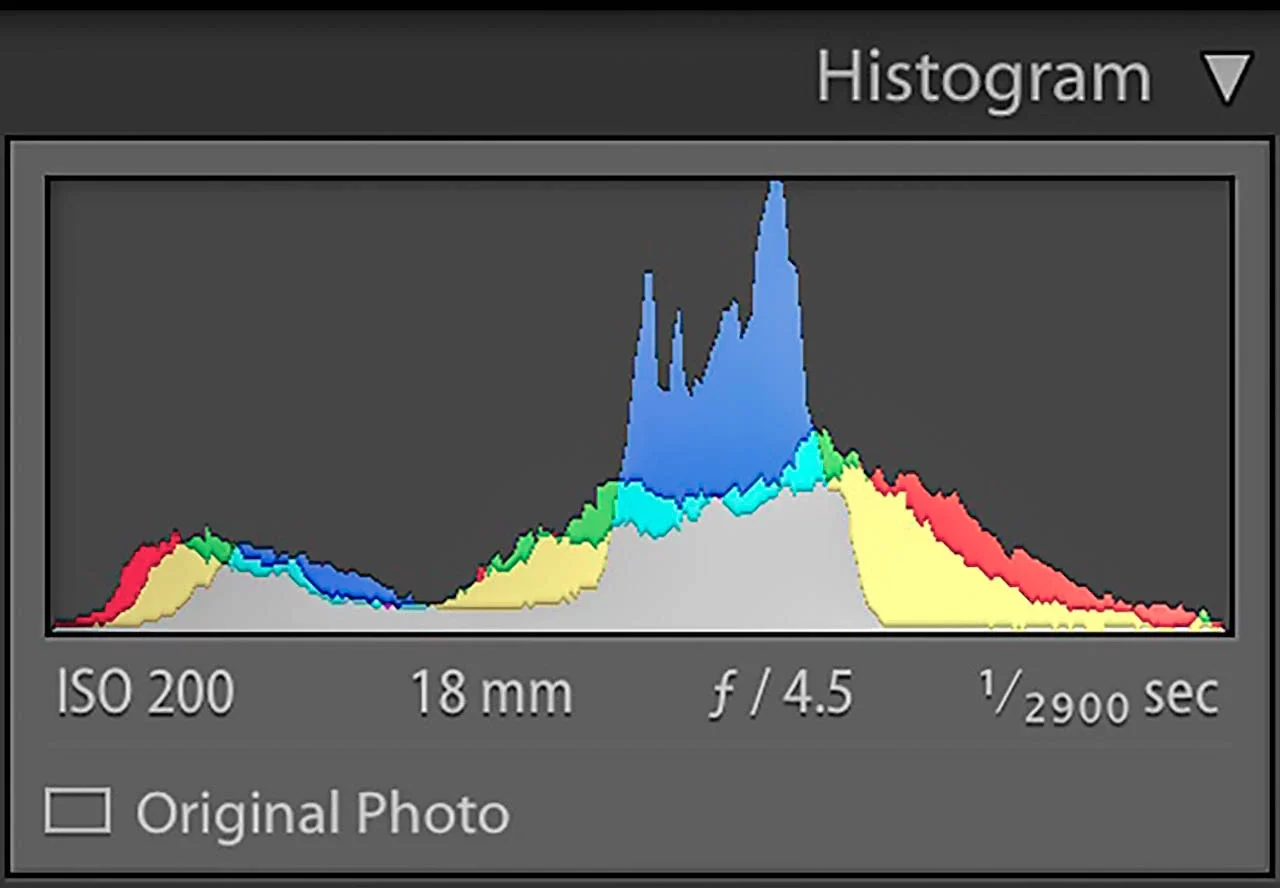
Your camera displays an RGB histogram, with higher-end models displaying the specific, Red, Green and Blue Channels as well
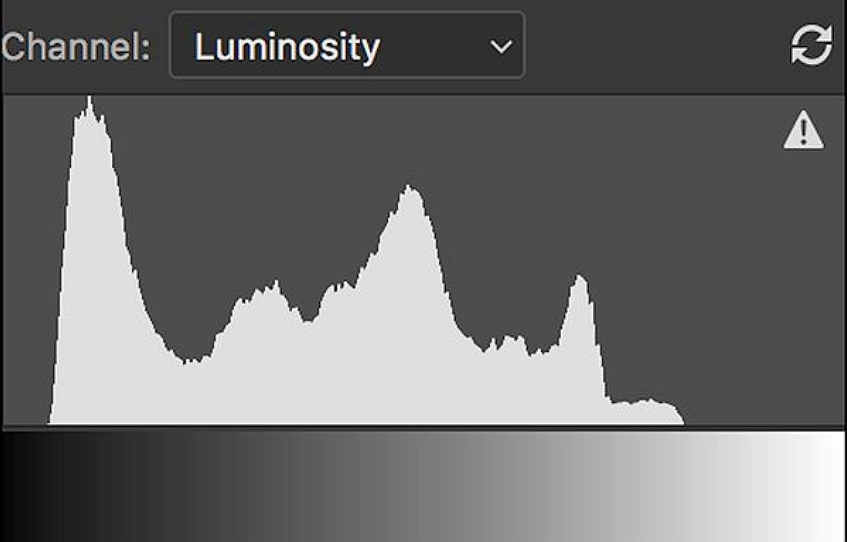
The luminosity histogram, shown by the grey area under the curve in the image above, denotes the number of pixels that exist for each tonal value within the image. Technical Note: Many photographers and computer programs refer to this as a luminance histogram. This is incorrect.
All color pixels within an image have a corresponding greyscale tonal value. This tonal value denotes how our eyes perceive the brightness of the specific colors, on a scale from black to white.
- Lightness, or luminosity, refers to how bright an object appears when it’s measured against a completely white object under identical lighting conditions.
- Lightness represents the perception of an object’s brightness by the human eye, assessed on a gradient ranging from black to white, devoid of any color data
- The scale that measures brightness or luminosity, extending from black through to white, is referred to as the tonal range or tonal scale.
On the histogram’s horizontal or x-axis, the extreme left signifies completely black pixels, while the extreme right denotes completely white pixels. The exact middle represents 50% grey pixels, which are an equal mix of black and white.
The vertical or y-axis represents the number of pixels in the image corresponding to each specific shade on the spectrum from black to white.
As the number of pixels for each tonal value on the x-axis increases within the image, the corresponding section of the histogram on the y-axis grows taller.